


Key Takeaways
- The U.S. economy grew by an annualized 3.3% in Q4 2023, beating expectations. Consumer confidence rose significantly due to lower inflation expectations and a robust labor market, despite some signs of cooling.
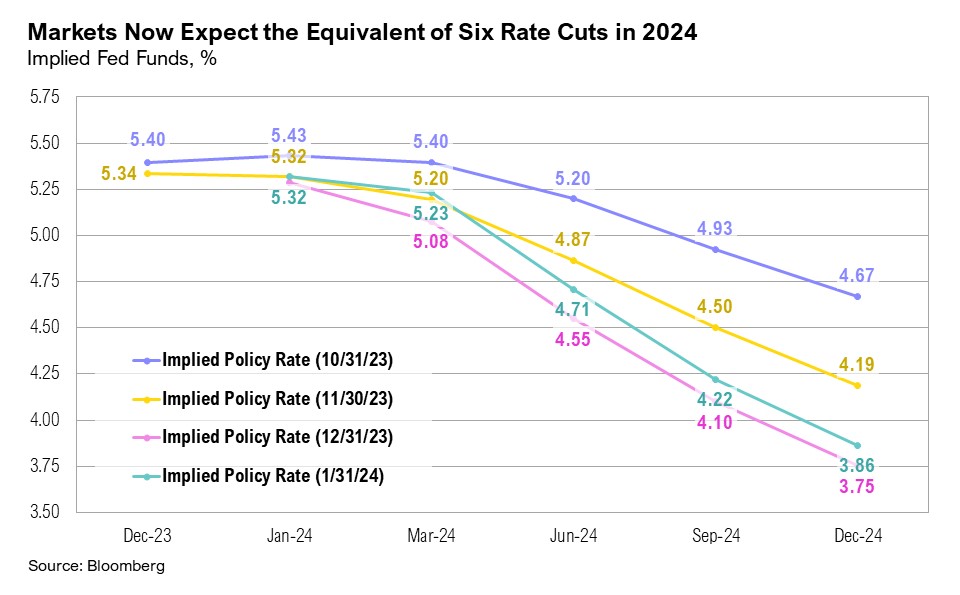
- At their first meeting of the year, the FOMC maintained interest rates at 5.25% - 5.50%, with market expectations leaning towards a first cut after March and a total of six rate cuts in 2024.
- Markets showed mixed results, with the S&P 500 reaching a record high and rising 1.7%, small cap stocks falling 3.9%, and U.S. intermediate-term bonds remaining flat.
- The S&P 500’s new highs were driven by a handful of large cap stocks, but the broader market remains subdued. Both the equal-weighted S&P 500 and small cap stocks are significantly below their prior peaks, highlighting the importance of diversification amid a divided market.
Overview
Markets began 2024 with mixed results. Despite the S&P 500 reaching a new all-time high on January 19, the last day of January was the worst day for the S&P 500 since September 2023. That was also the day of the Federal Open Market Committee meeting when Federal Reserve Chairman Jerome Powell erased any hopes of a March interest rate cut. U.S. large cap stocks, as proxied by the S&P 500, ended January up 1.7%. U.S. small cap stocks, as proxied by the Russell 2000, ended the month down 3.9% as hopes of a March interest rate cut dwindled. After an impressive turnaround in the fourth quarter that broke a two-year downward trend, U.S. intermediate-term bonds started the year relatively flat, ending January down 0.3%.
Preliminary estimates showed that the U.S. economy grew by an annualized 3.3% in the fourth quarter of 2023, far outpacing the expected 2.0%.1 Bolstered by robust economic growth and stock market gains, consumer confidence surged in January. The University of Michigan’s Consumer Sentiment Index recorded the largest positive two-month increase since the 1990s, jumping from 61.3 in November to 69.0 in December, and climbing further to 78.8 in January.2 The Conference Board’s Consumer Confidence Index climbed to a two-year high in January as expectations for lower inflation, lower interest rates, and a robust labor market boosted sentiment.3 Inflation expectations eased in January, as one-year expectations declined to 2.9% (from 3.1% in December) and longer-term expectations dropped to 2.8%.2
The labor market remained resilient throughout 2023 and into the first month of the new year. The unemployment rate held steady in January, at 3.7%, while the U.S. economy added 353,000 new jobs over the month, far outpacing the expected 170,000.4 Job openings rose to 9.02 million in December, reaching their highest level in three months.5 However, the labor market may be cooling. The quit rate declined to 2.2%, a level not seen since late 2020 and a potential sign of slowing wage growth.5 Further, Americans are still getting laid off—particularly those working in the technology sector. Over the past month alone, Alphabet, Amazon, Microsoft, Citigroup, and Wayfair (to name a few) have all announced job eliminations.6,7 Earlier in January, Microsoft announced that it will let go of 10,000 employees as it braces for slower revenue growth. It subsequently announced on January 25 that it will lay off 9% of its gaming division, less than three months after its acquisition of Activision Blizzard.8,9 PayPal also announced on January 30 that it plans to reduce its workforce by 9% and will be cutting 2,500 jobs in the coming months.10
On January 29, the U.S. Department of the Treasury announced its quarterly borrowing estimates. At nearly $2.4 trillion, Treasury issuance in 2023 was the second highest on record, behind only 2020. Treasury expects to borrow $760 billion in the first quarter of 2024, which outpaces several historic full-year issuances and the annual borrowing average of $721 billion since 2000.11
The FOMC met for the first time this year at the end of January and held rates steady at 5.25% - 5.50%, as was widely expected. Expectations for interest rate cuts in 2024 had increased since December 12, when Fed Chair Powell first alluded to the possibility. As of the end of January, markets were still pricing in the equivalent of six rate cuts this year. The December 2024 Fed funds rate is expected to be 3.9%, even though the possibility of a March rate cut all but evaporated during the post-FOMC press conference.12,13
The Size Divide
Throughout 2023, U.S. small cap stocks were plagued by recession worries and elevated interest rates, which have increased borrowing costs and are expected to further impact them as debts mature in the upcoming years. However, the fortunes of small caps improved dramatically in December, buoyed by growing optimism over potential rate cuts. This optimism propelled U.S. small cap stocks to gain 14% during the fourth quarter, surpassing U.S. large cap stocks, which ended the quarter up 11.7%.
However, the new year has brought new concerns for smaller companies, as hopes for a March interest rate cut diminished. Consequently, U.S. small cap stocks ended January down 3.9%, lagging large cap stocks’ 1.7% gain. Moreover, as the fourth-quarter earnings season unfolded, small companies revised their guidance downwards more substantially than their larger counterparts, signaling caution and perhaps even fear about the near-term outlook. Interest rates play a critical role in U.S. small cap stocks’ returns given these companies’ high levels of indebtedness. Approximately 40% of the Russell 2000 is unprofitable, and many small cap companies have large debt burdens and high borrowing costs.14 Given that interest rates remain at multi-decade highs, these companies may have to refinance their debt burdens at much higher rates. As a result, projections for the interest expense of Russell 2000 companies have risen to over 30% of EBITDA (a measure of a company’s operating performance, representing its earnings before interest, taxes, depreciation, and amortization).14
Despite these concerns, investors are still the most bullish on U.S. small caps they have been since June 2021. According to Bank of America, investors expect small cap companies to outperform large cap companies over the next 12 months.15 This sentiment might shift, however, as earnings season progresses. Nevertheless, small cap stocks tend to exhibit cyclical performance characteristics and continued economic growth, or even a potential reacceleration, could position profitable small caps quite favorably.
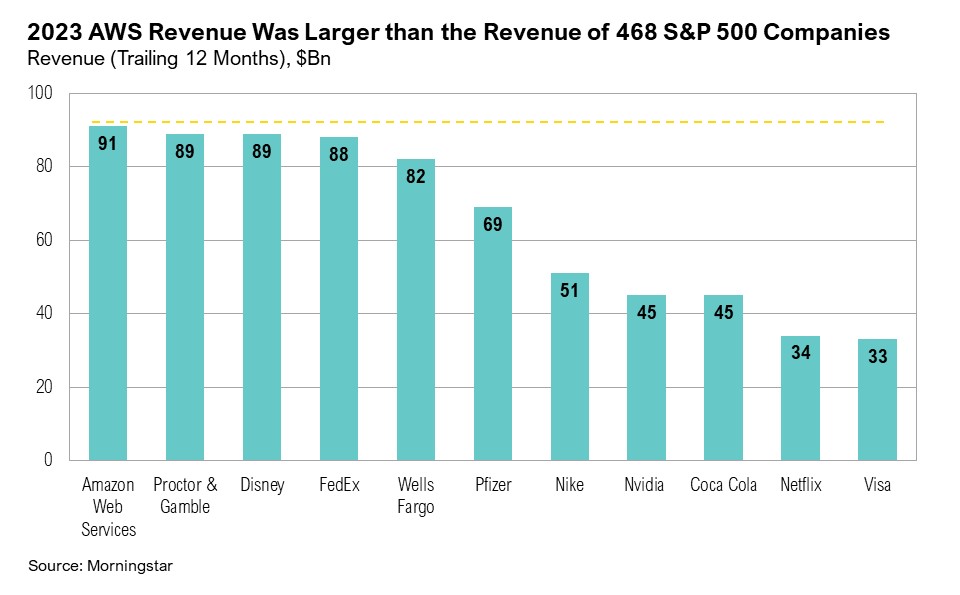
Most stock market gains over the past year have been driven by a few mega-cap companies, notably the “Magnificent Seven”: Microsoft, Amazon, Apple, Alphabet, Meta, Nvidia, and Tesla. Nvidia has been leading the way, ending January up 27.8%, followed by Meta, which ended the month up 14%, and Microsoft, up 8.8%. Amazon Web Services (AWS), a subsidiary of Amazon that offers cloud services such as computing power, storage, and databases, generated $91 billion in revenue in 2023, higher than the revenue of 468 companies in the S&P 500. Over the past 12 months, AWS revenue alone exceeded the revenue of Nvidia ($45 billion), Visa ($33 billion), Disney ($89 billion), Nike ($51 billion) and Wells Fargo ($82 billion), to name a few. Over the past decade, AWS revenue has grown at an eye-popping annualized average of 40%. But Amazon isn’t the only magnificent company enjoying remarkable outcomes. After reporting its fourth-quarter earnings, Meta’s market cap grew by $197 billion in one day—the largest single-day gain for any company in history.16
One formerly magnificent company has seemed far less magnificent in recent months. Tesla appears to have been ousted from the group due to its weak revenue, negative outlook, and leadership challenges that have plagued the company.,17,18 As a result, Tesla ended January down 24.7%. Apple may also be losing favor with investors as the company has struggled to rekindle the impressive historic growth rates that drove it to become one of the world’s largest companies. While its prospects may change, Apple ended January 0.7% lower, after reporting trailing 12-month revenue growth of 2.8% and earnings growth of just 0.3%.
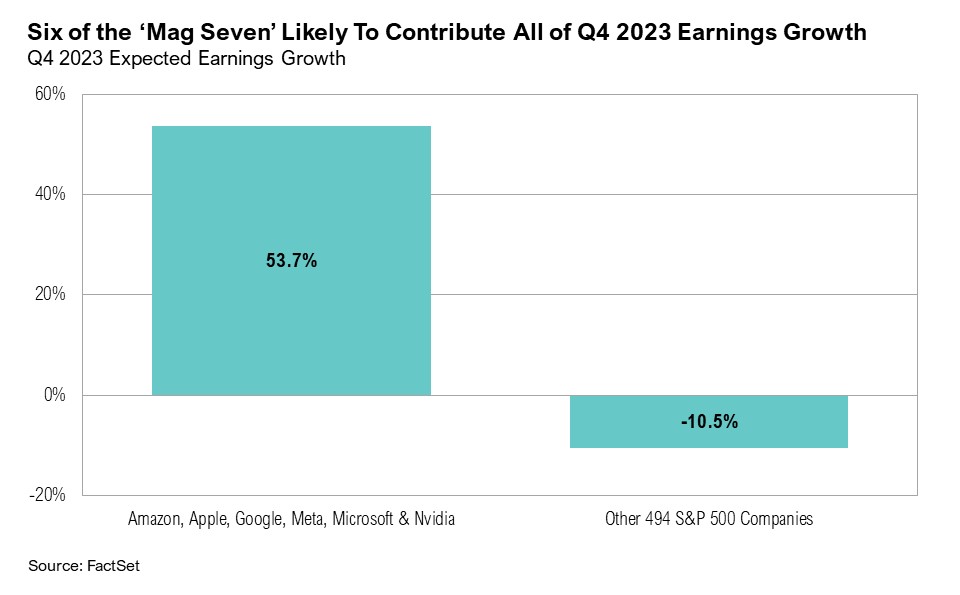
Nevertheless, several members of this group, including Alphabet, Microsoft, Meta, and Nvidia, enjoyed record-high share prices in January. The “Magnificent Six” stocks (i.e., excluding Tesla) are projected to report a combined year-over-year earnings growth of 53.7% for the fourth quarter of 2023.18 In contrast, the remaining 494 companies in the S&P 500 are expected to report an earnings decline of 10.5%, which speaks to the magnitude of influence that these mega-cap companies have had on the stock market. Overall, earnings for the S&P 500 are projected to rise by 1.8% for the fourth quarter.19,20
While it may be tempting to dismiss the recent divergence between all small and big companies, investors do appear to be discerning winners from losers and the impressive earnings growth of the large caps is a far cry from the last period in history with a similar ‘size divide’—the Tech Bubble. Only time will tell whether small cap stocks will emerge triumphant once the Fed starts cutting rates or if the mega-cap companies will continue to dominate.
Markets
January saw very mixed performance across various asset classes. As discussed above, U.S. large cap stocks were the top performers, while emerging and frontier market stocks were the worst performers, ending the month down 4.6%. U.S. intermediate-term bonds ended January down 0.3%, outperforming international developed market bonds, which ended the month down 3.0%. After a stellar 2023, midstream energy started 2024 on the back foot and ended January down 2.2%.
The 10-year Treasury yield climbed higher in January, reaching a high of 4.2% on January 24, following remarks by Fed Governor Christopher Waller and Atlanta Fed President Raphael Bostic on taking a slower approach to interest rate cuts than markets initially had hoped for. During his speech at the Brookings Institute on January 16, Governor Waller commented that:
“In many previous cycles, which began after shocks to the economy either threatened or caused a recession, the FOMC cut rates reactively and did so quickly and often by large amounts. This cycle, however, with economic activity and labor markets in good shape and inflation coming down gradually to 2%, I see no reason to move as quickly or cut as rapidly as in the past.”21
In commodity markets, West Texas Intermediate (WTI) crude surged to $78 per barrel on January 26, propelled by stronger-than-expected U.S. GDP growth for the fourth quarter and news of additional stimulus and policy support from China.22 However, WTI retreated slightly in the last week of January to end the month at $75 per barrel.22 On December 26, gold closed at a new all-time high of $2,077, thanks to expectations of imminent rate cuts, but it remained above $2,000 per ounce throughout January even as rate cut expectations moderated.23
Looking Forward
While investors have celebrated impressive earnings growth for a small subset of the U.S. large cap market that propelled the S&P 500 to a new all-time high, the equal-weighted S&P 500 remains about 5% below its all-time high set more than two years ago. Further, U.S. small cap stocks are currently more than 21% lower than their all-time highs, which they hit in late 2021. There’s a Wall Street adage that states that “markets are strongest when they are broad and weakest when they narrow to a handful of blue-chip names,” but given the unusual earnings backdrop that has supported this widely divergent market, investors may be understandably tempted to look past that.24
We continue to believe that there will be volatility in equity and fixed income markets in the coming year as investors focus their attention on trends in earnings, inflation, fiscal policy, and the buzz around the upcoming election. The unusual policy mix of extensive fiscal spending combined with expectations of easier monetary policy and a vexing earnings backdrop to start the year may be enough to take any particularly bad outcomes off the table ahead of the election. We continue to favor both high-quality stocks and bonds, rather than being overly aggressive with opportunities in lower quality assets. Short-term bonds remain attractive, but investors should be prepared for changes to the yield curve as the Federal Reserve contemplates policy changes this year. Since investors can’t predict the future, we believe that the tried-and-true strategy of diversification remains truer than ever. During uncertain times, the key to successful investing is often remaining committed to long-term investment plans.
Citations
1. Bureau of Economic Analysis: https://www.bea.gov/data/gdp/gross-domestic-product
2. University of Michigan: https://data.sca.isr.umich.edu/fetchdoc.php?docid=74601
3. Conference Board: https://www.conference-board.org/topics/consumer-confidence
4. Bureau of Labor Statistics: https://www.bls.gov/news.release/pdf/empsit.pdf
5. Bloomberg: https://www.bloomberg.com/news/articles/2024-01-30/us-job-openings-unexpectedly-rise-to-three-month-high
6. Bloomberg: https://www.bloomberg.com/news/articles/2024-01-30/should-i-be-worried-about-layoffs-where-to-expect-job-cuts-in-2024
7. New York Times: https://www.nytimes.com/2023/01/20/business/google-alphabet-layoffs.html
8. CNBC: https://www.cnbc.com/2024/01/25/microsoft-lays-off-1900-workers-nearly-9percent-of-gaming-division-after-activision-blizzard-acquisition.html
9. CNBC: https://www.cnbc.com/2023/01/18/microsoft-is-laying-off-10000-employees.html
10. Reuters: https://www.reuters.com/business/payments-firm-paypal-cut-around-2500-jobs-bloomberg-news-2024-01-30/
11. U.S. Department of the Treasury: https://home.treasury.gov/news/press-releases/jy2054
12. CME: https://www.cmegroup.com/markets/interest-rates/cme-fedwatch-tool.html
13. Federal Reserve: https://www.federalreserve.gov/mediacenter/files/FOMCpresconf20240131.pdf
14. Barron’s: https://www.barrons.com/articles/small-cap-stocks-be-careful-149ab956
15. Yahoo Finance: https://finance.yahoo.com/news/investors-havent-loved-small-cap-stocks-this-much-in-nearly-3-years-heres-why-191741930.html
16. Bloomberg: https://www.bloomberg.com/news/articles/2024-02-02/meta-s-meta-200-billion-surge-is-biggest-in-stock-market-history
17. Reuters: https://www.reuters.com/business/autos-transportation/tesla-gross-margin-falls-fourth-quarter-2024-01-24/
18. CNN: https://edition.cnn.com/2024/02/05/business/tesla-stock-elon-musk-board/index.html
19. FactSet: /https://advantage.factset.com/hubfs/Website/Resources%20Section/Research%20Desk/Earnings%20Insight/EarningsInsight_012624A.pdf
20. FactSet: https://advantage.factset.com/hubfs/Website/Resources%20Section/Research%20Desk/Earnings%20Insight/EarningsInsight_020224.pdf
21. Brookings Institute: https://www.brookings.edu/events/a-conversation-with-federal-reserve-governor-christopher-waller/
22. OilPrice.com: https://oilprice.com/oil-price-charts/
23. GoldPrice.org: https://goldprice.org/
24. Nasdaq: https://www.nasdaq.com/articles/wall-street-legend-bob-farrells-10-rules
Index Definitions
The S&P 500 Index is widely regarded as the best single gauge of the United States equity market. It includes 500 leading companies in leading industries of the U.S. economy. The S&P 500 focuses on the large cap segment of the market and covers approximately 75% of U.S. equities.
The Bloomberg Barclays U.S. Aggregate Index represents securities that are SEC-registered, taxable, and dollar denominated. The index covers the U.S. investment grade fixed rate bond market, with index components for government and corporate securities, mortgage pass-through securities, and asset-backed securities. Duration is roughly 5 years.
The Bloomberg U.S. Corporate High Yield Bond Index measures the USD-denominated, high yield, fixed-rate corporate bond market. Securities are classified as high yield if the middle rating of Moody’s, Fitch and S&P is Ba1/BB+/BB+ or below. Bonds from issuers with an emerging markets country of risk, based on the indices’ EM country definition, are excluded.
The Russell 1000® Value Index measures the performance of the large-cap value segment of the U.S. equity universe. It includes those Russell 1000 companies with lower price-to-book ratios and lower expected and historical growth rates.
The Russell 1000® Growth Index measures the performance of the large- cap growth segment of the US equity universe. It includes those Russell 1000 companies with relatively higher price-to-book ratios, higher I/B/E/S forecast medium term (2 year) growth and higher sales per share historical growth (5 years).
The Russell 2000® Index measures the performance of the small-cap segment of the US equity universe. It includes approximately 2000 of the smallest US equity securities in the Russell 3000 Index based on a combination of market capitalization and current index membership. The Russell 2000 Index represents approximately 10% of the total market capitalization of the Russell 3000 Index. Because the Russell 2000 serves as a proxy for lower quality, small cap stocks, it provides an appropriate benchmark for RMB Special Situations.
MSCI EAFE Index*: an equity index which captures large and mid-cap representation across 21 of 23 Developed Markets countries around the world, excluding the U.S. and Canada. With 926 constituents, the index covers approximately 85% of the free float-adjusted market capitalization in each country.
The MSCI Emerging Markets Index* measures equity market performance in the global emerging markets universe. It covers over 2,700 securities in 21 markets that are currently classified as EM countries. The MSCI EM Index universe spans large, mid and small cap securities and can be segmented across all styles and sectors.
The U.S. Dollar Index is used to measure the value of the dollar against a basket of six foreign currencies: the euro, Swiss franc, Japanese yen, Canadian dollar, British pound, and Swedish krona.
The Deutsche Bank EM FX Equally Weighted Spot Index, an equal-weighted basket of 21 emerging market currencies.
MSCI U.S. REIT Index is a free float-adjusted market capitalization weighted index that is comprised of equity Real Estate Investment Trusts (REITs). The index is based on the MSCI USA Investable Market Index (IMI), its parent index, which captures the large, mid and small cap segments of the USA market. With 150 constituents, it represents about 99% of the US REIT universe and securities are classified under the Equity REITs Industry (under the Real Estate Sector) according to the Global Industry Classification Standard (GICS®), have core real estate exposure (i.e., only selected Specialized REITs are eligible) and carry REIT tax status.
Performance Disclosures
All market pricing and performance data from Bloomberg, unless otherwise cited. Asset class and sector performance are gross of fees unless otherwise indicated.
*Source: MSCI.MSCI makes no express or implied warranties or representations and shall have no liability whatsoever with respect to any MSCI data contained herein. The MSCI data may not be further redistributed or used as a basis for other indexes or any securities or financial products. This report is not approved, endorsed, reviewed or produced by MSCI. None of the MSCI data is intended to constitute investment advice or a recommendation to make (or refrain from making) any kind of investment decision and may not be relied on as such.
The opinions and analyses expressed in this newsletter are based on Curi RMB Capital, LLC’s (“Curi RMB”) research and professional experience are expressed as of the date of our mailing of this newsletter. Certain information expressed represents an assessment at a specific point in time and is not intended to be a forecast or guarantee of future results, nor is it intended to speak to any future time periods. Curi RMB makes no warranty or representation, express or implied, nor does Curi RMB accept any liability, with respect to the information and data set forth herein, and Curi RMB specifically disclaims any duty to update any of the information and data contained in this newsletter. The information and data in this newsletter does not constitute legal, tax, accounting, investment or other professional advice. Returns are presented net of fees. An investment cannot be made directly in an index. The index data assumes reinvestment of all income and does not bear fees, taxes, or transaction costs. The investment strategy and types of securities held by the comparison index may be substantially different from the investment strategy and types of securities held by your account. RMB Asset Management is a division of Curi RMB Capital.